
 A House Divided
 Grand Century
 Margin of Victory
 Desktop client
The commodity exchange
Goods trade on one exchange that spans the whole scenario. Every plant that needs an input, in any region, sees every seller's stock in any region plus the outside market's import offer in its own region. The exchange fills the cheapest delivered offer first, so local producers feed local plants and the outside market is the last resort. Knowing how it ranks offers tells you where to build, what to charge and when to stockpile.
How it works#
Each week, before plants run, the exchange does this for every good:
- Each buyer states how much it needs and what it can pay.
- Each offer gets a delivered price: the seller's asking price plus freight over the cheapest route (see Freight). The outside market's import offer in the buyer's own region has no freight added.
- Offers are sorted from cheapest delivered price to dearest and filled in that order. Buyers tied on the same offer share it in proportion to what each still wants and can pay for.
- The seller receives its asking price. The buyer pays the freight to the carrier. Goods arrive within the week.
- Whatever is not filled is a shortage, and your plant runs below capacity.
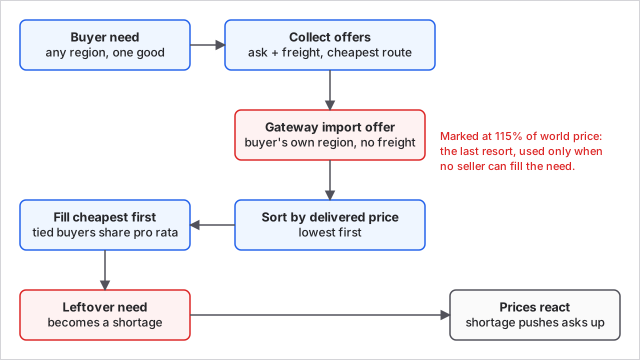
The outside market is made of gateways: finite import and export offers at world price minus or plus 15 percent. A gateway sells to you at 115 percent of the world price and buys from you at 85 percent, so selling to it is a last resort too. Its capacity is limited, but it grows by 1 percent for every week your region's exports filled it.
Key numbers#
| Item | Value |
|---|---|
| Gateway sell price (import) | 115 percent of world price |
| Gateway buy price (export) | 85 percent of world price |
| Manual price limits | 50 to 200 percent of reference price |
| Automatic price move per week | At most 2 percent |
| Automatic price range | Within 30 percent of reference |
| Plant yard (free storage) | 6 weeks of that plant's inputs and outputs |
| Outside storage fee per lot per week | Warehouse 80 cents, tank farm 120, silo 60, cold store 200 |
| Spoilage per week | Food 4 percent, groceries 4, livestock 3, grain 1.5 |
| Spoilage cut in owned storage | 80 percent |
| Buy to store | Up to 5,000 lots per order, 400 lots per week, 6 orders, open 13 weeks |
| Longest stock target | 26 weeks of inputs |
Prices#
A good's price is set by its seller. On automatic pricing it follows sell-through:
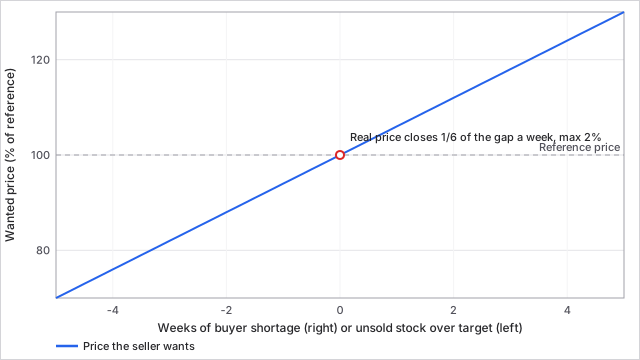
- If buyers are left short of the stock they want to keep, the seller raises its ask by 6 percent for every week of their use they lack.
- If the seller holds more unsold stock than its target (2 weeks of sales, 1 week for perishables), it cuts its ask by 6 percent for every week over.
- The price closes one sixth of the gap to that target each week and never moves more than 2 percent in a week, so it follows the market over about six weeks.
Local sellers therefore sit under the import price once freight is added, and local goods win. When local supply covers demand, the price eases back toward its reference.
World prices#
Eleven families of goods have a world price that moves every week: oil and fuel, natural gas, coal, iron ore and metals, steel, grain and farm output, fertilizer, chemicals and plastics, timber, rare earths and building materials. In Silicon Valley, chips and electronics follow a path too. The world price sets what gateways charge and pay. The path is chosen when you start a game:
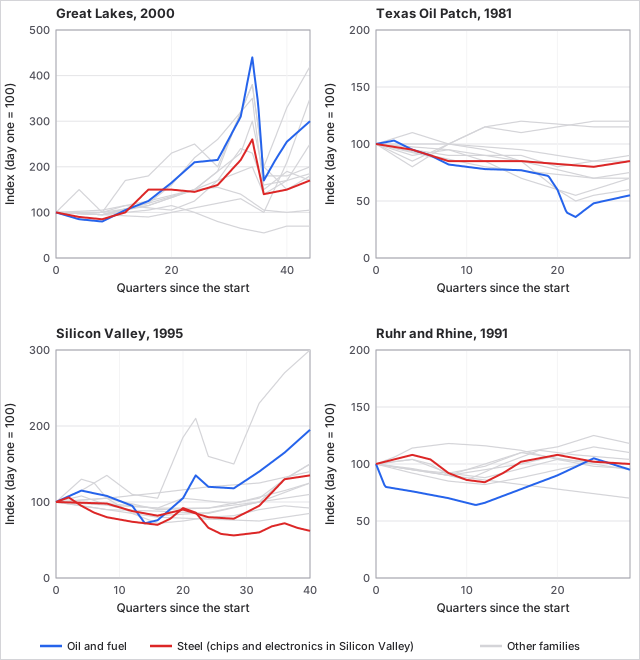
Authored historical paths. Day one is 100. Variance mode shifts and rescales these shapes.
| Mode | What it does |
|---|---|
| Historical | The scenario's real shape on the real dates. Identical every game. |
| Historical with variance | The same shape, shifted in time by up to 20 weeks overall plus up to 10 per family, with each swing 60 to 140 percent as deep. Drawn from your game's seed. |
| Random | A neutral drift around the starting price with no scripted busts. Busts come only from the business cycle. |
A fall in world prices feeds the business cycle as a demand shock (see Governments and market laws). An index never leaves 20 to 800 percent of its day-one level.
Chains#
Plants can make several products at once. Oil is a real chain: wells pump crude oil and refineries turn it into gasoline, jet fuel and feedstock. Iron runs from blast furnace to pig iron to steel, with scrap from steel works feeding electric arc furnaces. Mixed farms grow grain and raise livestock, and food processing turns both into food. A plant that loses an input slows down, so a break in a chain spreads downstream.
Storage#
Goods take up space, and storage comes in four classes: warehouse (steel, consumer goods and other dry goods), tank farm (oil, gas, chemicals), silo (grain, ore, coal, fertilizer, building materials) and cold store (food, livestock, pharmaceuticals).
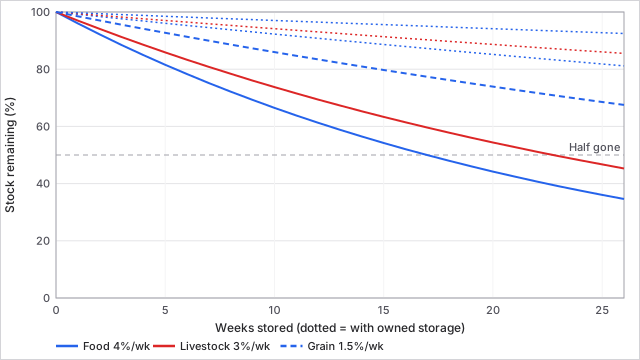
Each operating plant brings a free yard that holds 6 weeks of its inputs and outputs. Stock beyond your yard and your own storage sits in the region's outside storage and pays a weekly fee per lot. Goods are never refused or destroyed for lack of room. Stock beyond the yard also pays a small holding cost, a weekly share of the good's reference value. Perishable goods spoil each week, and owned storage cuts the loss by 80 percent for the stock that fits in it.
Worked example. A steel plant in region A needs 50 lots a week. Steel's reference price is $400 a lot. Three offers reach it: a seller in region B asks $380 and freight over 500 km by truck adds $15 a lot (3 cents per lot-km), so $395 delivered; a local seller asks $430; the gateway imports at $460. The exchange fills B's $395 first, then the local $430, and touches the gateway at $460 only if both run out. If B has only 30 lots, the plant takes 30 at $395 and 20 at $430, an average of $408.
Storage example. You hold 1,000 lots of food in a region with a cold store that fits 600 lots. Food spoils 4 percent a week, cut to 0.8 percent for stock inside the cold store, so that 600 lots lose 4.8 lots a week and the other 400 lose 16, about 21 lots in all. Any lots beyond your yard and your cold store pay 200 cents a week each in outside fees.
What you can do#
- Set prices in CEO Office under pricing for each good: leave it automatic, price against the market (minus 50 to plus 50 percent), mark up your own cost (0 to 100 percent), or fix a price between 50 and 200 percent of reference. A fixed price stays until you hand the good back. Automatic is safest, because a fixed price too high sells nothing and one too low gives value away.
- Build storage (warehouses, tank farms, silos, cold stores) as logistics plants. They hold stock for you, cut spoilage and earn fees from other firms' overflow.
- Set a stock target for a plant, from 0 to 26 weeks of inputs. Zero uses your firm-wide default. A seasonal build, on by default, buys 8 extra weeks of grain in the harvest quarter (third quarter).
- Buy to store. In the Command Center, queue an order for a good in a region, with a quantity and a price limit. Each week it buys up to 400 lots from the cheapest delivered sellers within your limit and adds them to held stock. Held goods are not offered on the exchange or exported. Sell from store releases them again.
Tips: store goods before an expected price rise and sell into a spike; spoilage makes storing food a poor bet without a cold store; and if a plant stops because its input sits in the next region, check the delivered price, not the asking price.
Connections#
Driven by
- Freight: freight sets the delivered price, so a cheaper lane makes a distant seller competitive.
- Governments and market laws: the business cycle shifts demand and world prices; the strategic reserve and production quotas change supply.
- Currencies: gateway prices follow each country's money.
- Regions and labour: regional demand and local output set what is for sale where.
- Rivals: speculator rivals buy to store and sell into spikes, moving prices.
- Your holding company: group members buy from each other before the open market.
Affects
- Currencies: trade across a currency line creates the receivables that carry FX gain and loss.
- Freight: every cross-region purchase books lane demand and fills lanes.
- Your holding company: input prices drive plant margins and the transfer price a group supplier compares itself to.
- Governments and market laws: a price collapse feeds the cycle as a demand shock and triggers quotas and reserve buying.
- Rivals: who wins local contracts decides which rivals grow.
Status#
Live in every scenario and difficulty. What differs by scenario is the default world price path: Historical in Great Lakes 2000 and Ruhr and Rhine 1991, Historical with variance in Texas Oil Patch 1981 and Silicon Valley 1995 (see Scenarios). The strategic reserve and production quotas depend on which party is in government.
Last checked: 2026-10-29, version 1.8.0
Technical detail: every constant, formula and source file is in Exact rules at the end of this page.
Exact rules#
All rules run inside the weekly turn. Sources are in the game's public repository.
Delivered-price matching#
Source: crates/cw-sim/src/economy/markets.rs (clear_goods_exchange).
- Pairings are keyed by delivered price (ask plus freight), then seller, then buyer. The strategic reserve's release is sorted ahead of everything else as an emergency sale.
- Each gateway is its own source and sorts after every firm seller at an equal price.
- A buyer only takes what its cash covers. Tied buyers split an offer with
allocate_centsin proportion to want, limited by affordable quantity. - Seller sells stock beyond its own plants' input cover.
- Gateway prices:
sell_price = reference + 15 percent,buy_price = reference - 15 percent(crates/cw-sim/src/economy/seed.rs). Gateway capacity is the corridor volume split by regional demand, at least 40 lots (100 for electricity).EXPORT_ROOM_GROWTH_BPS = 100(markets.rs): after a week whose exports filled the gateway, capacity grows by 1 percent, at least 1 lot. Growth stops once a week leaves room unused.
Sell-through pricing#
Source: crates/cw-sim/src/economy/pricing.rs.
WANT_BPS_PER_HUNDREDTH_WEEK = 6: 6 percent of reference per whole week of gap.goods_wanted_bps: gap is held between -500 and +500 hundredths of a week, so the wanted price is 10,000 plus gap times 6 basis points, within 30 percent of reference. Where plants buy the good:gap = short_weeks - max(cover - target, 0). Otherwisegap = target - cover.cover_target_hundredths: 200 (2 weeks) for goods, 100 for goods with spoilage of 200 basis points or more a week.PRICE_LAG_WEEKS = 6: a price closes one sixth of the gap to its wanted price each week.MAX_WEEKLY_MOVE_BPS = 200.- A good with no sales and stock on the shelf wants 7,000 basis points (70 percent of reference). Services read the share of capacity that sold: reference at 85 percent used, plus 0.6 percent per point above and minus the same below, between 80 and 115 percent (
service_wanted_bps). IDLE_REVERSION_WEEKS = 26eases a price with no sales signal back toward reference.- Manual price: 50 to 200 percent of reference (
crates/cw-sim/src/commands.rs,SetPrice). Price posture: market from -5,000 to +5,000 basis points, cost-plus from 0 to 10,000 (SetPricePosture). Posture prices the good immediately, not at the next weekly review. - Perishable input cover is capped at 2 weeks (
pricing.rs,cover_weeks).
World price paths#
Source: crates/cw-sim/src/economy/world_prices.rs, content/price-paths.json.
- Families and weights: oil 30, natural gas 10, coal 5, ore 10, steel 10, grain 15, fertilizer 5, chemicals 5, timber 4, rare earths 2, building materials 4, electronics 20 (listed-only). Cyclical sensitivity per family ranges from 25 percent (grain) to 110 percent (electronics).
INDEX_FLOOR_BPS = 2,000,INDEX_CEIL_BPS = 80,000; day one is 10,000. Quarter is 13 weeks.- Historical with variance: global shift uniform in -20 to 20 weeks, plus uniform -10 to 10 per family; depth uniform 60 to 140 percent.
- Random:
RANDOM_BAND_BPS = (5,000, 20,000),REVERSION_DIVISOR = 32(half-life about 22 weeks). - Cycle link:
DEMAND_FEED_PCT = 8,FEED_LIMITS = (-15, 10)a week into the cycle's momentum in historical modes;TILT_PCT = 30of the unexplained output gap tilts every family, scaled by its cyclical share. - Default per scenario:
content/scenarios.json(default_price_path).
Storage#
Source: crates/cw-sim/src/economy/storage.rs, crates/cw-data/src/balance.rs, content/initial-balance.json.
YARD_WEEKS = 6.PROTECTED_SPOILAGE_CUT_BPS = 8,000.SEASON_EXTRA_WEEKS = 8.HARVEST_QUARTER = 3.MAX_STOCK_WEEKS = 26.- Buy to store:
MAX_ORDER_LOTS = 5,000,MAX_ORDERS = 6,ORDER_LOTS_PER_WEEK = 400,ORDER_WEEKS = 13. Price limit 5,000 to 20,000 basis points of reference (commands.rs). - Outside storage fee in cents per lot per week (
StorageClass::outside_fee_cents): dry 80, tank 120, silo 60, cold 200. - Holding cost per week, basis points of reference price (
content/initial-balance.json,holding_bps_weekly): dry goods 8, tank 6, silo 5, cold 12. It applies only to stock beyond the yard. - Weekly spoilage basis points (
spoilage_bps_weekly): food 400, groceries 400, livestock 300, grain 150. Goods at 200 or more count as perishable. Spoilage with owned storage isbase * (10,000 - 8,000 * protected_share / 10,000) / 10,000. - Order of weekly work: storage fees and holding cost, then spoilage. A firm pays what its cash covers and never goes negative. Fees go pro rata to other firms with spare owned space in the same region and class; the rest goes to the outside sector.
Strategic reserve#
Source: crates/cw-sim/src/economy/reserve.rs. Buys under 85 percent of the 52-week average price (BUST_PCT), up to 300 lots a week per good (BUY_LOTS_PER_WEEK), up to 4,000 lots per good (MAX_STOCK_LOTS), spending at most 1/40 of its cash a week (BUDGET_DIVISOR). Sells over 120 percent of the average (SPIKE_PCT) or 110 percent of its purchase price (PROFIT_PCT), up to 150 lots a week per region (SELL_LOTS_PER_WEEK). Needs 26 weeks of price history (MIN_HISTORY).
Edge cases#
- Services and contracts take no storage space and are never shipped or stored.
- A pipeline lane has no outside backstop: a shipment either fits or takes another mode (see Freight).
- No offer at all in range means a shortage; the plant runs below capacity.
- Tied buyers never starve a small buyer by firm order.